

RSBT
Bonds & Managed Futures
Why Invest in RSBT ETF?
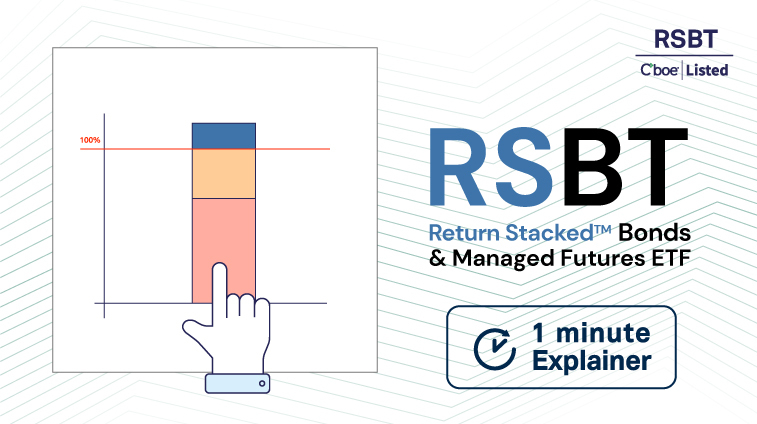
For every $1 invested, RSBT is designed to provide $1 of broad U.S. bond exposure and $1 of a managed futures strategy.
Investment Case
Capital Efficiency: Aims to provide simultaneous exposure to U.S. bonds and a managed futures strategy. For every $1 invested, the RSBT aims to provide $1 of exposure to U.S. bonds and $1 of exposure to a managed futures strategy.
Diversification: RSBT seeks to provide exposure to a managed futures strategy that has historically exhibited low correlation to both stocks and bonds.
Inflation Hedging: With the ability to go both long and short global futures markets (including equities, bonds, commodities, and currencies), managed futures has historically exhibited inflation-hedging characteristics.
Diversification does not assure a profit.
Fund
Overview
The Fund seeks long-term capital appreciation by investing in two complimentary investment strategies: a bond strategy and a managed futures strategy. For every $1 invested, the Fund attempts to provide $1 of exposure to its bond strategy and $1 of exposure to its managed futures strategy.
The bond strategy seeks to capture the total return of the broad U.S. fixed income market by investing in U.S. Treasury securities, broad-based bond ETFs, or U.S. Treasury futures contracts.
The managed futures strategy will invest using a trend-following strategy in futures contracts among four major asset classes: commodities, currencies, equities, and fixed income.
Fund FAQs
RSBT rebalances daily
The Bond strategy within RSBT can hold U.S. Treasuries, bond ETFs, and U.S. Treasury futures, or any combination thereof.
For example, RSBT may hold 50% in a broad US bond ETF and gain the remaining 50% bond exposure through a ladder of Treasury futures contracts.
- 50% iShares Core U.S. Aggregate Bond ETF (“AGG”)
- 12.5% US 2-year Treasury Note Future Contract
- 12.5% US 5-year Treasury Note Futures Contract
- 12.5% US 10-year Treasury Note Futures Contract
- 12.5% US Treasury Long Bond Futures Contract
The Managed Futures strategy will also have long or short positions in US Treasury futures, increasing or decreasing their net exposure.
The effective duration of the Bond strategy aims to approximately track that of the Bloomberg US Aggregate Bond Index.
As trends in bonds evolve so will the long and short positioning of bonds inside the ETF. By design this should be considered as an attempt to use trend signals to hedge against duration risk in bond portfolios when trends are down (by shorting) and at times increase duration exposure when trends are positive (by going long).
Top-Down Replication:
As an analogy, consider the example of trying to replicate the returns of an active, long-term stock picker. The top-down approach would be akin to trying to identify the portfolio of stocks – i.e. both the stocks and the weights – that best replicates their returns by regressing his track record on the universe of global stocks.
Unlike a long-term stock picker, trend-following managed futures funds can change their positions rapidly. As a result, the replicating portfolio must be fit at each daily time-step, using returns to the index and the explanatory markets over the preceding days and weeks. Each model fit yields weights for a portfolio of representative markets which, if held over the term of the regression, minimize the difference between tracking portfolio returns and benchmark returns.
Pros: Agnostic of how managers run their portfolios; can adapt to model innovation.
Cons: Can only use most recent data to estimate current portfolio; may miss sudden changes in underlying manager positions.
Bottom-Up Replication:
If the top-down approach is akin to trying to figure out which stocks a long-term stock picker owns, the bottom-up approach is akin to trying to figure out which characteristics they use to pick stocks. In other words, if we can identify the strategy they use for picking stocks, we can try to implement that strategy ourselves.
Bottom-up replication is aimed at uncovering the underlying strategies that funds in the index are using to form portfolios. A combination of time-series momentum, price versus moving average, multiple moving average, or breakout systems are typically employed in trend-following strategies to identify market trends.
Pros: Can use much more data to create stable estimates; can capture sudden changes in weights.
Cons: Will not necessarily capture model innovation among managers.
30% of the Managed Futures strategy is allocated to the top-down approach and 70% is allocated to the bottom-up approach.
Since their joint inception on 12/31/1999 through 3/31/2023, the Bloomberg US Aggregate Bond Index (“LBUSTRUU”) and the Société Générale Trend Index (“NEIXCTAT”) have exhibited realized annualized volatility levels of 4.0% and 13.6% respectively. An equal-weight portfolio of these two indices, levered up 200% (and financed at the Bloomberg Short-Term Treasury Total Return Index (“LD12TRUUU”), exhibited a realized annualized volatility of 14.3% over the same period.
There are tax considerations to be aware of when implementing RSBT into portfolios. For example, daily gains and losses in futures contracts may need to be calculated as realized for tax purposes, which may affect ordinary income or capital gains depending upon the contract. You should consult your tax advisor before investing.
Distributions, if any, are expected to be made annually at the end of each calendar year.
Fund
Details
Fund Details
| wdt_ID | New column | New column |
|---|---|---|
| 1 | Fund Inception | 2/7/2023 |
| 2 | Ticker | RSBT |
| 3 | Primary Exchange | CBOE |
| 4 | CUSIP | 88636J105 |
| 5 | NAV Symbol | RSBT.NV |
| 6 | Expense Ratio | 0.97% |
| Name | value | date |
|---|---|---|
| 30-Day SEC Yield | 2.42 |
| Name | value | date |
|---|---|---|
| 30-Day SEC Yield | 2.42 | 03/31/2024 |
*The 30-Day Yield represents net investment income earned by the Fund over the 30-Day period ended on the date indicated by the Yield, expressed as an annual percentage rate based on the Fund’s share price at the end of the 30-Day period. The 30-Day unsubsidized SEC Yield does not reflect any fee waivers/reimbursements/limits in effect.
Fund Data & Pricing
| Name |
|---|
| 04/18/2024 |
| Name | value |
|---|---|
| Net Assets | $57.47m |
| NAV | $17.96 |
| Shares Outstanding | 3,200,000.00 |
| Premium/discount Percentage | -0.11% |
| Closing Price | $17.94 |
| Median 30 Day Spread** | 0.39% |
**30 Day Median Spread is a calculation of Fund’s median bid-ask spread, expressed as a percentage rounded to the nearest hundredth, computed by: identifying the Fund’s national best bid and national best offer as of the end of each 10 second interval during each trading day of the last 30 calendar days; dividing the difference between each such bid and offer by the midpoint of the national best bid and national best offer; and identifying the median of those values.
Performance
| Name |
|---|
| 03/31/2024 |
| Fund Name | Fund Ticker | 1 Month | 3 Month | 6 Month | YTD | 1 Year | 3 Year | 5 Year | Since Inception Cumulative | Since Inception Annualized | Date |
|---|---|---|---|---|---|---|---|---|---|---|---|
| Return Stacked Bonds & Managed Futures ETF | RSBT NAV | 4.12 | 4.36 | 3.28 | 4.36 | 1.52 | – | – | -7.52 | -6.62 | |
| Return Stacked Bonds & Managed Futures ETF | RSBT MKT | 4.7 | 5.19 | 3.31 | 5.19 | 1.73 | – | – | -7.12 | -6.26 | |
| Bloomberg US Agg Total Return Value Unhedged USD | LBUSTRUU | 0.92 | -0.78 | 5.99 | -0.78 | 1.7 | – | – | 2.48 | 2.16 |
| Name |
|---|
| 03/31/2024 |
| Fund Name | Fund Ticker | 1 Month | 3 Month | 6 Month | YTD | 1 Year | 3 Year | 5 Year | Since Inception Cumulative | Since Inception Annualized | Date |
|---|---|---|---|---|---|---|---|---|---|---|---|
| Return Stacked Bonds & Managed Futures ETF | RSBT NAV | 4.12 | 4.36 | 3.28 | 4.36 | 1.52 | – | – | -7.52 | -6.62 | |
| Return Stacked Bonds & Managed Futures ETF | RSBT MKT | 4.70 | 5.19 | 3.31 | 5.19 | 1.73 | – | – | -7.12 | -6.26 | |
| Bloomberg US Agg Total Return Value Unhedged USD | LBUSTRUU | 0.92 | -0.78 | 5.99 | -0.78 | 1.7 | – | – | 2.48 | 2.16 |
The performance data quoted above represents past performance. Past performance does not guarantee future results. The investment return and principal value of an investment will fluctuate so that an investor’s shares, when sold or redeemed, may be worth more or less than their original cost and current performance may be lower or higher than the performance quoted above.
Short term performance, in particular, is not a good indication of the fund’s future performance, and an investment should not be made based solely on historical returns. Returns beyond 1 year are annualized.
A fund’s NAV is the sum of all its assets less any liabilities, divided by the number of shares outstanding. The market price is the most recent price at which the fund was traded.
Top 10 Holdings
| Name |
|---|
| 04/19/2024 |
| Date | Account | StockTicker | Security Name | CUSIP | Shares | Price | Market Value | Weightings | NetAssets | SharesOutstanding | CreationUnits | MoneyMarketFlag |
|---|---|---|---|---|---|---|---|---|---|---|---|---|
| RSBT | ADM4 Curncy | AUDUSD Crncy Fut Jun24 | ADM4 CURNCY | -74 | 64.31 | -4,758,570.00 | -8.28% | 57,468,480 | 3,200,000 | 128 | ||
| RSBT | AGG | iShares Core U.S. Aggregate Bond ETF | 464287226 | 299,811 | 95.28 | 28,565,992.08 | 49.71% | 57,468,480 | 3,200,000 | 128 | ||
| RSBT | BPM4 Curncy | BP CURRENCY FUT Jun24 | BPM4 CURNCY | -64 | 124.39 | -4,975,600.00 | -8.66% | 57,468,480 | 3,200,000 | 128 | ||
| RSBT | CDM4 Curncy | C$ CURRENCY FUT Jun24 | CDM4 CURNCY | -47 | 72.66 | -3,415,020.00 | -5.94% | 57,468,480 | 3,200,000 | 128 | ||
| RSBT | CLM4 Comdty | WTI CRUDE FUTURE Jun24 | CLM4 COMDTY | 23 | 82.10 | 1,888,300.00 | 3.29% | 57,468,480 | 3,200,000 | 128 | ||
| RSBT | COM4 Comdty | BRENT CRUDE FUTR Jun24 | COM4 COMDTY | 53 | 87.11 | 4,616,830.00 | 8.03% | 57,468,480 | 3,200,000 | 128 | ||
| RSBT | ECM4 Curncy | EURO FX CURR FUT Jun24 | ECM4 CURNCY | -151 | 1.07 | -20,140,568.75 | -35.05% | 57,468,480 | 3,200,000 | 128 | ||
| RSBT | ESM4 Index | S&P500 EMINI FUT Jun24 | ESM4 INDEX | 35 | 5,049.00 | 8,835,750.00 | 15.38% | 57,468,480 | 3,200,000 | 128 | ||
| RSBT | FGXXX | First American Government Obligations Fund 12/01/2031 | 31846V336 | 17,360,215 | 100.00 | 17,360,215.44 | 30.21% | 57,468,480 | 3,200,000 | 128 | Y | |
| RSBT | FVM4 Comdty | US 5YR NOTE (CBT) Jun24 | FVM4 COMDTY | 48 | 104.95 | 5,037,375.02 | 8.77% | 57,468,480 | 3,200,000 | 128 | ||
| RSBT | G M4 Comdty | LONG GILT FUTURE Jun24 | G M4 COMDTY | -45 | 96.75 | -5,418,481.64 | -9.43% | 57,468,480 | 3,200,000 | 128 | ||
| RSBT | GCM4 Comdty | GOLD 100 OZ FUTR Jun24 | GCM4 COMDTY | 74 | 2,398.00 | 17,745,200.00 | 30.88% | 57,468,480 | 3,200,000 | 128 | ||
| RSBT | GXM4 Index | DAX INDEX FUTURE Jun24 | GXM4 INDEX | 21 | 18,062.00 | 10,104,157.79 | 17.58% | 57,468,480 | 3,200,000 | 128 | ||
| RSBT | HGK4 Comdty | COPPER FUTURE May24 | HGK4 COMDTY | 43 | 443.65 | 4,769,237.50 | 8.30% | 57,468,480 | 3,200,000 | 128 | ||
| RSBT | HOM4 Comdty | NY Harb ULSD Fut Jun24 | HOM4 COMDTY | 5 | 254.22 | 533,862.00 | 0.93% | 57,468,480 | 3,200,000 | 128 | ||
| RSBT | JYM4 Curncy | JPN YEN CURR FUT Jun24 | JYM4 CURNCY | -464 | 65.26 | -37,850,800.00 | -65.87% | 57,468,480 | 3,200,000 | 128 | ||
| RSBT | NGK24 Comdty | NATURAL GAS FUTR May24 | NGK24 COMDTY | -104 | 1.76 | -1,827,280.00 | -3.18% | 57,468,480 | 3,200,000 | 128 | ||
| RSBT | NQM4 Index | NASDAQ 100 E-MINI Jun24 | NQM4 INDEX | 18 | 17,547.25 | 6,317,010.00 | 10.99% | 57,468,480 | 3,200,000 | 128 | ||
| RSBT | NXM4 Index | NIKKEI 225 (CME) Jun24 | NXM4 INDEX | 24 | 37,820.00 | 4,538,400.00 | 7.90% | 57,468,480 | 3,200,000 | 128 | ||
| RSBT | PTM4 Index | S&P/TSX 60 IX FUT Jun24 | PTM4 INDEX | 29 | 1,303.10 | 5,494,514.92 | 9.56% | 57,468,480 | 3,200,000 | 128 | ||
| RSBT | RXM4 Comdty | EURO-BUND FUTURE Jun24 | RXM4 COMDTY | -28 | 131.21 | -3,914,713.15 | -6.81% | 57,468,480 | 3,200,000 | 128 | ||
| RSBT | SIN4 Comdty | SILVER FUTURE Jul24 | SIN4 COMDTY | 31 | 28.66 | 4,442,765.00 | 7.73% | 57,468,480 | 3,200,000 | 128 | ||
| RSBT | TUM4 Comdty | US 2YR NOTE (CBT) Jun24 | TUM4 COMDTY | -217 | 101.48 | -44,042,523.55 | -76.64% | 57,468,480 | 3,200,000 | 128 | ||
| RSBT | TYM4 Comdty | US 10YR NOTE (CBT)Jun24 | TYM4 COMDTY | -187 | 107.70 | -20,140,484.38 | -35.05% | 57,468,480 | 3,200,000 | 128 | ||
| RSBT | USM4 Comdty | US LONG BOND(CBT) Jun24 | USM4 COMDTY | 64 | 114.13 | 7,304,000.00 | 12.71% | 57,468,480 | 3,200,000 | 128 | ||
| RSBT | VGM4 Index | EURO STOXX 50 Jun24 | VGM4 INDEX | 120 | 4,891.00 | 6,253,942.55 | 10.88% | 57,468,480 | 3,200,000 | 128 | ||
| RSBT | XBK4 Comdty | GASOLINE RBOB FUT May24 | XBK4 COMDTY | 6 | 271.37 | 683,852.40 | 1.19% | 57,468,480 | 3,200,000 | 128 | ||
| RSBT | Z M4 Index | FTSE 100 IDX FUT Jun24 | Z M4 INDEX | 66 | 7,901.00 | 6,489,931.55 | 11.29% | 57,468,480 | 3,200,000 | 128 | ||
| RSBT | Cash&Other | Cash & Other | Cash&Other | 11,537,423 | 1.00 | 11,537,423.16 | 20.08% | 57,468,480 | 3,200,000 | 128 | Y |
Holdings are subject to change without notice.
How to Buy
The Fund is available through various channels, broker-dealers, investment advisers, and other financial services firms, including:


The Fund, the Investment Adviser, Sub-Adviser, and Distributor are not affiliated with these financial service firms. Their listing should not be viewed as a recommendation or endorsement.
Investors should consider the investment objectives, risks, charges, and expenses carefully before investing. For a prospectus or summary prospectus with this and other information about the Fund, please click here. Read the prospectus or summary prospectus carefully before investing.
Investments involve risk. Principal loss is possible. Unlike mutual funds, ETFs may trade at a premium or discount to their net asset value. Brokerage commissions may apply and would reduce returns.
Derivatives Risk. Derivatives are instruments, such as futures contracts, whose value is derived from that of other assets, rates, or indices. The use of derivatives for non-hedging purposes may be considered to carry more risk than other types of investments. Cayman Subsidiary Risk. By investing in the Fund’s Cayman Subsidiary, the Fund is indirectly exposed to the risks associated with the Subsidiary’s investments. The futures contracts and other investments held by the Subsidiary are subject to the same economic risks that apply to similar investments if held directly by the Fund. The Subsidiary is not registered under the 1940 Act, and, unless otherwise noted in the Fund’s Prospectus, is not subject to all the investor protections of the 1940 Act. Bond Risks. The Fund will be subject to bond and fixed income risks through its investments in U.S. Treasury securities, broad-based bond ETFs, and investments in U.S. Treasury and fixed income futures contracts. Changes in interest rates generally will cause the value of fixed-income and bond instruments held by Fund (or underlying ETFs) to vary inversely to such changes. Commodity Risk. Investing in physical commodities is speculative and can be extremely volatile. Commodity-Linked Derivatives Tax Risk. The tax treatment of commodity-linked derivative instruments may be adversely affected by changes in legislation, regulations, or other legally binding authority. As a registered investment company (RIC), the Fund must derive at least 90% of its gross income each taxable year from certain qualifying sources of income under the Internal Revenue Code. If, as a result of any adverse future legislation, U.S. Treasury regulations, and/or guidance issued by the Internal Revenue Service, the income of the Fund from certain commodity-linked derivatives, including income from the Fund’s investments in the Subsidiary, were treated as non-qualifying income, the Fund may fail to qualify as RIC and/or be subject to federal income tax at the Fund level. The uncertainty surrounding the treatment of certain derivative instruments under the qualification tests for a RIC may limit the Fund’s use of such derivative instruments. Commodity Pool Regulatory Risk. The Fund’s investment exposure to futures instruments will cause it to be deemed to be a commodity pool, thereby subjecting the Fund to regulation under the Commodity Exchange Act and the Commodity Futures Trading Commission rules. Because the Fund is subject to additional laws, regulations, and enforcement policies, it may have increased compliance costs which may affect the operations and performance of the Fund. Credit Risk: Credit risk refers to the possibility that the issuer of a security will not be able to make principal and interest payments when due. Changes in an issuer’s credit rating or the market’s perception of an issuer’s creditworthiness may also affect the value of the Fund’s investment in that issuer. Currency Risk: Currency risk is the risk that changes in currency exchange rates will negatively affect securities denominated in, and/or receiving revenues in, foreign currencies. The liquidity and trading value of foreign currencies could be affected by global economic factors, such as inflation, interest rate levels, and trade balances among countries, as well as the actions of sovereign governments and central banks. Foreign and Emerging Markets Risk. Foreign and emerging market investing involves currency, political and economic risk. Leverage Risk: As part of the Fund’s principal investment strategy, the Fund will make investments in futures contracts to gain long and short exposure across four major asset classes (commodities, currencies, fixed income, and equities). These derivative instruments provide the economic effect of financial leverage by creating additional investment exposure to the underlying instrument, as well as the potential for greater loss. Non-Diversification Risk. The Fund is non-diversified, meaning that it is permitted to invest a larger percentage of its assets in fewer issuers than diversified funds. Underlying ETFs Risk. The Fund will incur higher and duplicative expenses because it invests in bond ETFs. The Fund may also suffer losses due to the investment practices of the underlying bond ETFs. New Fund Risk. The Fund is a recently organized with no operating history. As a result, prospective investors do not have a track record or history on which to base their investment decisions.
Toroso Investments, LLC (“Toroso”) serves as investment adviser to the Funds and the Funds’ Subsidiary.
Newfound Research LLC (“Newfound”) serves as investment sub-adviser to the Funds.
ReSolve Asset Management SEZC (Cayman) (“ReSolve”) serves as futures trading advisor to the Fund and the Funds’ Subsidiary.
Foreside Fund Services, LLC is the distributor for the Funds. Foreside is not related to Toroso, Newfound, or ReSolve.